Making your first map
Welcome to the Redistricter Quickstart. Here I’ll walk you through the process of:
Creating Your First Map
Begin by navigating to the map browser. This page displays all previously created maps. To generate a new map:
- Select your desired state from the dropdown menu in the right sidebar.
- Leave the default settings unchanged for now.
- Click Create Map to initialize your map.

Reading Data
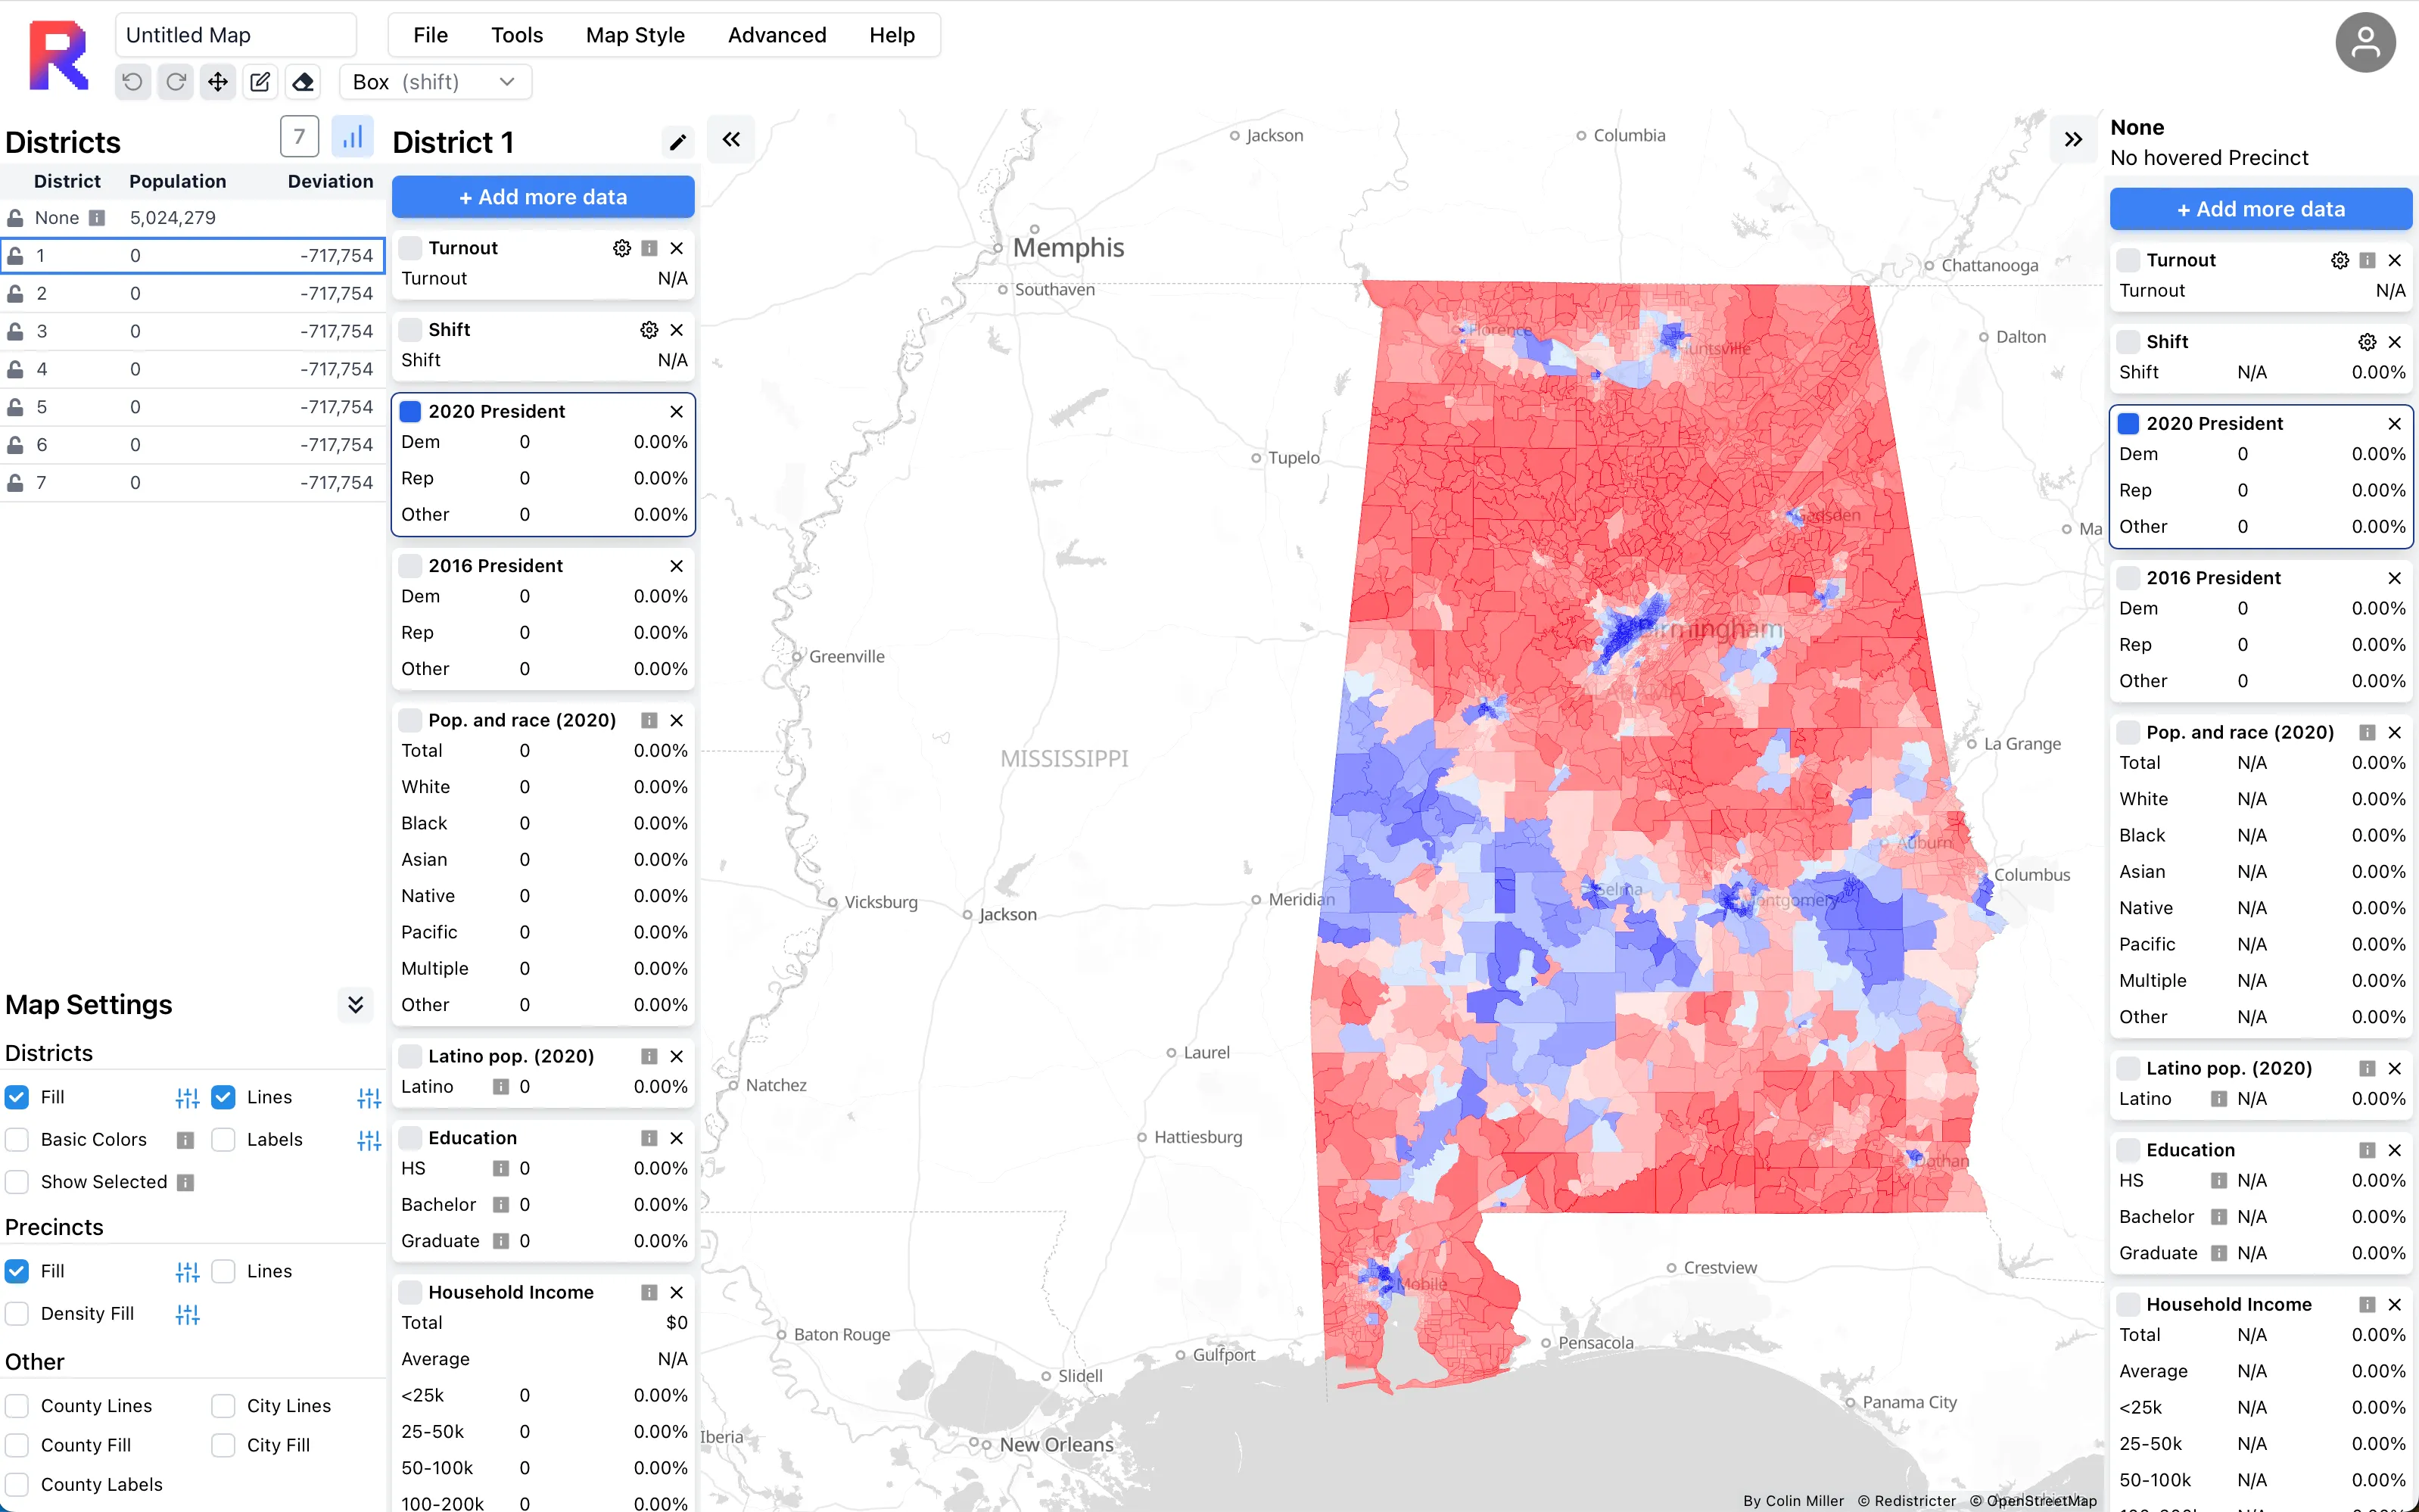
After your map loads, it will display various geographical features, such as precincts or census block groups (default).
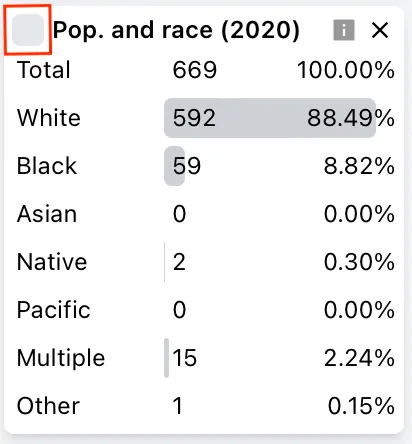
- Sidebar Interaction: Hover over any feature on the map; the right sidebar will update to show relevant data for that feature.
- Adding Data: To include more datasets, click the Add more data button at the top of the sidebar.
Using the Map
Navigation
- Zoom: Use your scroll wheel or pinch gestures on a trackpad.
- Pan: Click and drag to move around the map.
Data Visualization
The map initially shows the 2020 presidential election results. To view different data, select another dataset from the sidebar and click the dataset icon (highlighted in red).
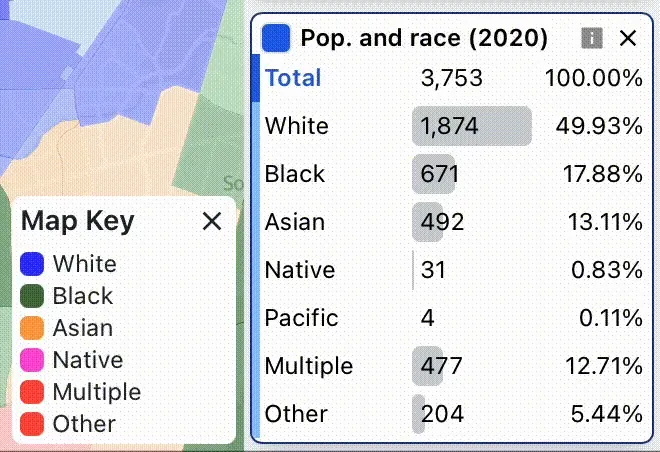
Map Modes: Some datasets have multiple map modes that can be triggered by clicking on the title of one of the rows (shown below).
Drawing a district
Basic controls
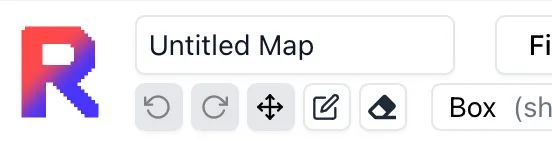
There are 3 different modes of interaction with the map:
- Pan: To move the map by clicking and dragging
- Draw: To add features to a district
- Erase: To remove features from a district
These options can be toggled by clicking the relevant icon in the top left of the screen. For now, select the draw option.
Adding a feature to a district
- Select a District: Choose a district from the Districts Sidebar; it will highlight in blue.
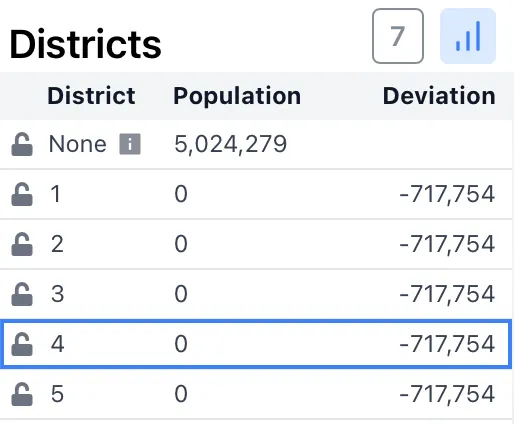
- Add Features: In draw mode, click or drag over features to add them to your district.
Choosing Draw Types
Select a draw type from the dropdown menu to define how features are added or removed to a district:
- County: Automatically includes all features within any selected county.
- City: Like the country option but for cities.
- Brush: Selects all features within a specified radius. Adjust the radius by selecting a brush size from the dropdown next to the draw type selector.
- Draw: Allows you to draw a custom shape and add all features within that shape to a district.
- Box: Adds all features within a drawn box. Click and drag on the map to create the box.
Drawing the district
Once you’ve done all of the above you can click on a feature to add it to the district. The sidebar to the right of the districts sidebar will display the statistics for the district you’ve just drawn.
Congratulations! You’ve now completed the Redistricter Quickstart!